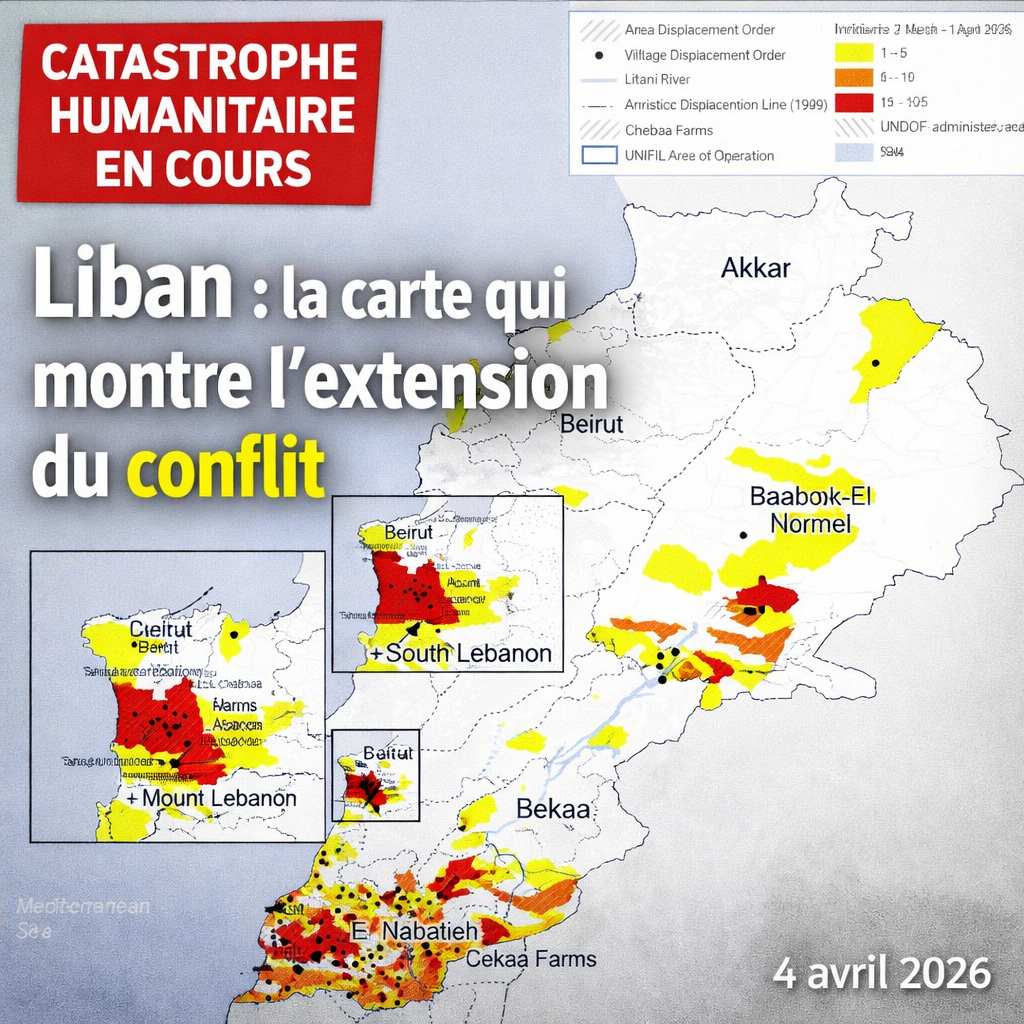
The map published by OCHA for the period from 2 March to 1 April 2026 offers an immediate reading of the ongoing war in Lebanon. It shows a country where the South still concentrates most of the incidents, but where the Bekaa, Baalbek-Hermel and the southern suburbs of Beirut now appear as directly affected areas. By crossing the intensity of fighting and displacement orders, this document sheds light on a broader reality than a single front: that of fragmented territory, increasingly constrained mobility and a humanitarian crisis.
A map of Lebanon dominated by the South
The first reading of this map of Lebanon is brutal. South Lebanon and Nabatiyah governorate immediately emerged from the density of the red and orange zones, which reported the highest concentration of incidents during the period observed. The detailed inserts reinforce this impression around Tyre, Bint Jbeil, Marjayoun and near the Blue Line. In a month, the border area has become the visible heart of the conflict. The map of the city does not say only where the fighting was the most numerous. It also shows where war has become repetitive, almost structural, to the point of transforming people’s daily lives.
This concentration in the South is in line with the findings released in recent days by international agencies. Hostilities remain particularly intense along the border, with shelling, artillery exchanges and reported incursions near the Blue Line. Reuters reported that the Israeli Minister of Defense was referring to a buffer zone up to the Litani after the war, giving a new strategic depth to reading the map. The red is therefore not just a peak of violence. It also refers to a space under sustained military pressure, where the possibilities of return, movement and resumption of civilian activities are reduced day after day.
In the most affected areas, this permanence of risk changes everything. A village that suffers repeated strikes does not only lose buildings. It also loses its ability to function. Schools close, shops stop, roads become uncertain, medical services deteriorate and families hesitate between leaving too early or staying too long. That’s where the card becomes valuable. It not only gives a geography of explosions. She draws a geography of exhaustion. It shows how a month of conflict can be enough to transform inhabited areas into areas of precarious presence.
Beirut and Mount Lebanon fully enter the conflict map
The other strong element of the document is the insert on Beirut and Mount Lebanon. Its mere presence has a political and symbolic value. It means that the capital and its immediate periphery can no longer be read as a relatively preserved back. The southern suburbs are clearly distinguished, with areas marked by both incidents and displacement orders. In other words, Beirut is no longer just the city that receives the displaced. It also becomes a space directly affected by war.
This shift profoundly alters the country’s situation. For years, even in times of tension, Beirut remained a relatively separate administrative, economic and logistical centre. However, when the southern suburbs of the capital appear on a humanitarian map of the intensity of the conflict, this separation is effaced. UNICEF points out that strikes in dense urban areas, especially in the southern suburbs of Beirut, may lead to further massive displacements while reception capacity is already under strain. The Associated Press reported on 1 April that Beirut was facing a massive influx of internally displaced persons, with improvised shelters and visible pressure on public spaces.
This combination of welcoming displaced persons and increasing exposure to war creates a paradoxical situation. The capital remains a relative refuge for some of the families, but it no longer guarantees the same distance from the strikes. The more peripheral neighbourhoods are affected, the more fragile the idea even of a stable retreat space becomes. This paradox can be seen in a few seconds from the map of the OCHA. It shows a Lebanon where urban centres are no longer simply the place to respond to the crisis. They in turn become pieces of the crisis itself.
The Bekaa and Baalbek-Hermel are no longer rear areas
The map of Lebanon also draws attention to Bekaa and Baalbek-Hermel. Yellow, orange and red areas appear clearly, indicating a spread of risk to the east of the country. This geographical extension is crucial. It shows that the conflict does not focus solely on the southern border. It also affects territories that play a key role in internal displacement, supply roads and the reception of displaced populations. When these regions also enter a map of military intensity, the entire territorial depth of Lebanon is reduced.
The stakes are not only military. He’s also a civilian. UNICEF reports that 17 incidents affected water systems in Baalbek-Hermel, Bekaa, South and Nabatieh, damaging reservoirs, pumping stations, solar equipment and main lines. These data show that an incident map is never an abstract document. Each coloured area also refers to damage to essential services. When water becomes more difficult to distribute, the health crisis worsens. When roads become more risky, the aid convoys slow down. When the host communities appear in turn on the conflict map, the ability of civilians to retreat becomes smaller.
The Bekaa and Baalbek-Hermel thus appear as a second level of vulnerability. They do not replace the South as a centre of military gravity, but they show that war is well beyond the border. This has a direct consequence for the coming weeks: the more the crisis spreads to these regions, the more the whole of Lebanon becomes a restricted area of traffic, saturated reception and weakened services. The map therefore does not merely illustrate an increase in tensions. It reveals a profound transformation of the national territory.
Displacement orders redraw map of Lebanon
One of the most important aspects of this document is the overlap between incidents and displacement orders. The legend distinguishes between areas where orders have targeted specific villages and areas where they have affected wider areas. This point is decisive, as it shows that war does not only act through physical destruction. It also acts by injunction to leave, to evacuate, to bypass, not to return. A town still partially intact may become uninhabitable if it enters the perimeter of a displacement order. A practical road may cease to be used if it crosses an area deemed dangerous. This new geography of uncertainty can precisely be seen from the map of OCHA.
This reading is confirmed by the humanitarian figures. As at 1 April, more than 1.1 million people were displaced in Lebanon, including more than 390,000 children. Of these, 136,321 persons were accommodated in 669 official collective centres. This means that a considerable proportion of internally displaced persons are outside formal arrangements, with relatives, in precarious housing, in schools transformed into shelters or in improvised facilities. Reuters also reported that the Lebanese government was preparing for a protracted displacement crisis, with very insufficient funding and partial coverage of basic needs. The more displacement orders multiply, the more the map of Lebanon reads as a map of pressure on the host areas.
This mechanism has a cumulative effect. Travel orders do not only move families. They also move the social, educational, health and economic burden to other territories. A municipality that receives new households needs more water, housing, transport, care and schooling. However, when these municipalities are also in affected areas, the chain of solidarity becomes fragile. This is what the map highlights without even needing long comments: in Lebanon, war no longer opposes a front and a rear. It produces a series of coerced territories linked by forced displacement.
Behind the map, a massive human crisis
The document of the OCHA takes even more prominence when it is brought closer to the human balance. As at 1 April, at least 1,318 people had been killed in Lebanon, including 125 children, and 3,935 injured, including 429 children, according to figures reported by UNICEF from the Ministry of Public Health. These data show that the civilian impact of the conflict is already massive. They also recall that the coloured areas on the map correspond to places of life, not mere military coordinates. Each colour change refers to affected families, empty quarters, displacement, injuries and deaths.
The health crisis is worsening at the same time. UNICEF reported 82 attacks on emergency medical services since 2 March, 53 killed caregivers, 137 injured, 67 vehicles and 20 affected medical facilities, and five hospitals forced to close. In overcrowded accommodation centres, cases of scabies, lice and varicella have been reported. Access to care remains limited in several areas, particularly for displaced populations and those in difficult access areas. Again, the map of Lebanon helps to understand the extent of the problem. The more the incidents are concentrated in some regions, the faster the health systems in these same regions get.
So the crisis is not just that of bombing. It is also a crisis of continuity of services. A damaged pumping station, a closed hospital, an ambulance, a school converted to shelter: each of these elements seems limited in isolation. Together, they form a shift. Lebanon no longer faces a series of local incidents. It is facing a coordinated deterioration in its civilian capacity. The strength of the map is to show where these nodes of fragility form.
The school absorbed by the emergency
One of the greatest effects of this war is education. As at 1 April, 364 of the 669 official collective centres were State schools and 58 were technical and vocational schools. At the same time, 439 public schools in the South, Nabatieh, Bekaa, Baalbek and the southern suburbs of Beirut remained closed due to insecurity, evacuation orders or their proximity to the combat zones. A total of about 256,000 students are directly affected by these closures.
This data is central to understanding what the map of Lebanon actually shows. When an area passes from yellow to orange or red, it often means that an entire school network comes into suspension. War not only destroys buildings. She interrupts educational trajectories. It removes children from their classes, weakens exams, accentuates the inequalities between those who can take online courses and those who have no connection, no quiet place, no suitable material. UNICEF notes that the Ministry of Education has embarked on a gradual recovery through hybrid modalities in some safer areas, especially in the North and Akkar. But access remains very uneven. The card, read with these figures, also becomes a map of the risk of dropping out of school.
The cost of this break-up goes beyond school. In many cases, institutions serve as both a place of learning, shelter, aid distribution and a point of reference for communities. When they close or change function, it is a whole part of local stability that disappears. The educational crisis then becomes a sign of the general crisis. A country whose schools are turning massively into shelters is a country where war is already long-term.
A strategic reading of the territory
At the strategic level, the map shows three sets. First, a South saturated with incidents, where border logic remains dominant. Then, an oriental arc formed by the Bekaa and Baalbek-Hermel, which suggests pressure on the logistical and territorial depth of the country. Finally, an urban home around Beirut, proof that the capital is now part of the space of war. This tridistribution does not sum up the full complexity of the conflict, but it is sufficient to show that current operations act simultaneously on the border, traffic routes and population centres.
Reuters reported on 31 March that the Israeli Minister of Defense was talking about a goal of controlling up to the Litani and destroying houses in villages near the border. Whatever the legal and diplomatic debates surrounding these statements, the d’OCHA map already shows the possible effects: a high concentration of incidents in the South, massive displacements to the North, pressure on infrastructure and a gradual weakening of return possibilities. The publication of the document at the beginning of April therefore comes at a time when the question is no longer only that of the intensity of the fighting, but of the form that the geography of the conflict might take in the following weeks.
What this map says in the coming weeks
Several findings are clear from this reading.
- The South and Nabatieh remain the heart of military intensity.
- Beirut, in particular its southern suburbs, entered the active map of the conflict right away.
- The Bekaa and Baalbek-Hermel can no longer be considered as mere back areas.
- Displacement orders weigh as much as strikes in the transformation of the territory.
- The humanitarian crisis is becoming sustainable, as the host regions are also under pressure.
The great lesson of this map of Lebanon lies in this simple idea: the country is no longer organised around a front clearly separated from the rest. It appears to be a set of territories that are unevenly struck but closely interdependent. Degradation in the South increases pressure on Beirut. A strike in the Bekaa affects mobility. A movement order in a border village affects schools, rents, water and care well beyond the area concerned. It is this sequence logic that the map makes visible. It shows a conflict that extends through connections as well as contiguousness, and a Lebanon whose civil balance is redefined every day a little more.
Table of main indicators
| Indicator | Level observed on 1 April 2026 | Reading |
|---|---|---|
| Internally displaced | over 1.1 million | mass displacement at the national level |
| Displaced children | over 390 000 | High pressure on families and schools |
| Official collective centres | 669 | high demand reception network |
| Persons in collective centres | 136 321 | a minority of IDPs is in the formal system |
| People killed | at least 1,318 | heavyness of the human balance |
| Children killed | 125 | direct impact on minor civilians |
| Carers killed | 53 | health system directly affected |
| Public schools closed | 439 | major educational breakdown |
This table completes the map. Where the colours show the space of the shock, the figures show its social depth. They recall that a war is not just about bombarded neighbourhoods. It weakens institutions, schools, hospitals, water networks, reception mechanisms and local solidarity. Published at the beginning of April, this d